Contents
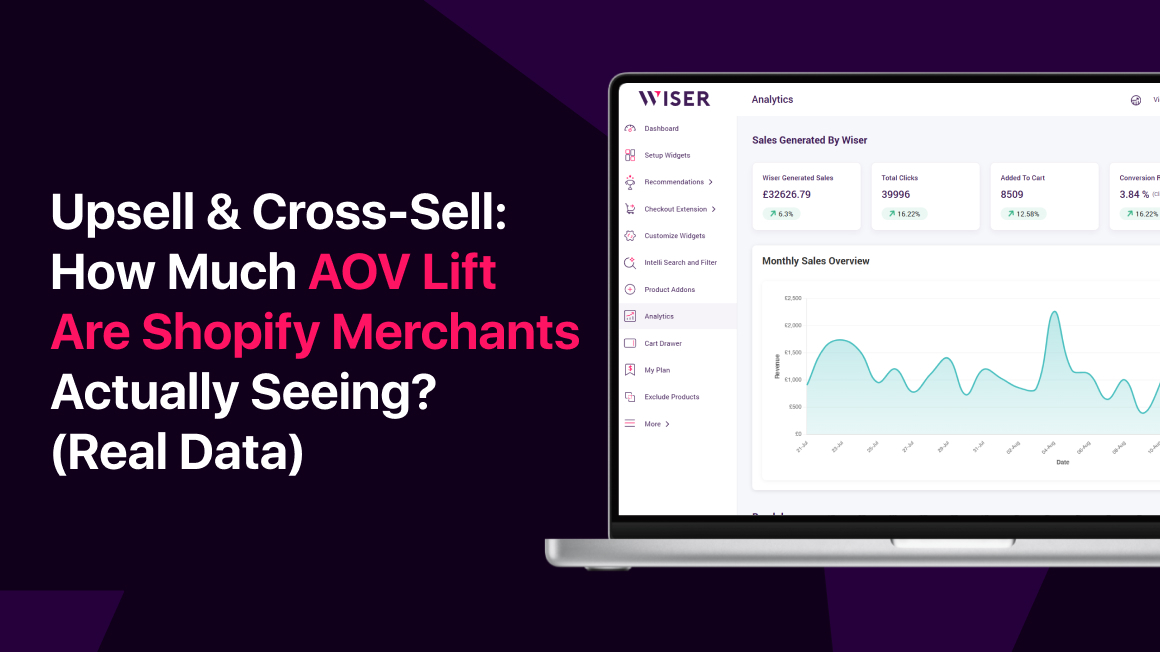
Upselling and cross-selling or upsell & cross-sell can meaningfully increase your AOV” is a claim nearly every app in this category makes. Few show the actual numbers behind it. This post does — pulling real, dashboard-verified figures from eight Shopify stores across three months, showing what share of their AI-driven revenue came specifically from upsell and cross-sell offers.
This isn’t a cherry-picked best case. It’s a straight read of eight stores, spanning beverages, footwear, fashion, accessories, home goods, and craft supplies, at wildly different catalog sizes — from small, focused specialty shops to a high-volume import business. The spread itself is part of the finding: even the weakest performer in this set still saw a substantial contribution from these two mechanics.
Before getting into the numbers, it’s worth being clear about what’s being measured and what isn’t. This is a real-world look at revenue contribution, not a marketing claim dressed up as data — which is also why the underlying dollar figures aren’t published here, at the merchants’ request. Only the percentages are shown.
How We Measured Upsell & Cross-Sell Revenue
Each store below uses Wiser AI’s recommendation engine across its storefront. For each one, we compared total revenue generated through upsell and cross-sell offers specifically against total Wiser-generated revenue overall (which also includes plain product recommendations outside the upsell/cross-sell category), over the same three-month window. Only the resulting percentage is shown — underlying revenue figures are kept confidential at the merchant’s request.
Upsell & Cross-Sell Data: Store by Store
Here’s how each of the eight stores broke down, ordered from highest to lowest share of AI-driven revenue coming from upsell and cross-sell offers specifically:
1) HopTea (Beverages) — 85.4% of Wiser-generated revenue came from upsell & cross-sell offers. The highest share in this set, consistent with a consumable product line where repeat and complementary purchases are a natural fit.
2) Naot Israel (Footwear) — 72.2%. A footwear brand with strong accessory and care-product tie-ins, which shows up clearly in how much of its AI-driven revenue these offers account for.
3) ReShoevN8r (Footwear Care) — 71.2%. A specialty footwear-care retailer, where cross-sell pairings (cleaning kits, protectants, accessories) map closely onto how customers already shop.
4) Squarehood (Fashion & Apparel) — 64.0%. A solid majority share for a fashion catalog, where outfit-style cross-sells and size/style upsells both have room to work.
5) Talis US (Accessories) — 55.8%. Just over half of AI-driven revenue tied to upsell and cross-sell, a strong showing for a smaller, focused catalog.
6) Afridi Imports (Home Goods, Import/Wholesale) — 51.3%. Still over half, even as one of the largest and most diversified catalogs in this set — notable given how many other revenue levers a store this size typically has in play.
7) Resin Rockers (Craft Supplies) — 41.0%. A niche, project-based catalog where customers often return for specific supplies rather than broad browsing, which naturally caps the ceiling somewhat versus more impulse-driven categories.
8) LNDA (Fashion & Apparel) — 32.5%. The lowest share in this set, but still representing roughly a third of all AI-driven revenue — a meaningful contribution on its own, not a sign of under performance.
Source: Wiser AI merchant dashboards, 3-month period, 2026. Underlying revenue figures kept confidential at merchant request — only the resulting percentage is shown.
What This Upsell & Cross-Sell Range Really Tells Us
| 32.5%–85.4% Range of AOV-lift share across all 8 stores | ~59% Average share across the full set | 8/8 Stores where upsell & cross-sell exceeded 30% of AI-driven revenue |
Every single store in this set saw upsell & cross-sell offers account for at least 32.5% of their AI-driven revenue — and in several cases, well over half. That floor is the more interesting number here, arguably more than the ceiling: even the store with the lowest share (LNDA, at 32.5%) is still seeing roughly a third of its AI-attributed revenue come directly from these two mechanics.
HopTea sits at the top of the range at 85.4%, followed closely by Naot Israel (72.2%) and ReShoevN8r (71.2%). None of these are outlier mega-brands — the set spans a beverage brand, a footwear-care company, a fashion retailer, and a home goods importer doing eight figures in volume (Afridi Imports), suggesting the pattern holds across both catalog size and category.
What a Wide Upsell & Cross-Sell Range Really Means
A 32.5%–85.4% spread might look like inconsistency at first glance. It’s more accurately a reflection of how differently upsell and cross-sell opportunities present themselves by catalog type.
- Stores with naturally complementary product lines (accessories, consumables, refills) tend to sit toward the higher end, since nearly every purchase has an obvious next-item recommendation
- Larger, more diversified catalogs (like Afridi Imports, a high-volume home goods importer) tend to land in the middle — strong overall performance, but upsell/cross-sell is one of several revenue levers rather than the dominant one
- The lower end of the range still represents a meaningful, consistent contribution — not a sign the mechanic under performs for that store type
What This Means for Your Category
- Consumable or repeat-purchase catalogs (beverages, supplements, refills): expect to be on the higher end of this range. HopTea’s 85.4% is the ceiling in this set for a reason — customers restocking one item are highly receptive to adding a related one.
- Accessory-rich categories (footwear, footwear care, fashion): expect to land in the 55–75% range. Naot Israel, ReShoevN8r, and Squarehood all cluster here, and all three have obvious, low-friction complementary items to offer.
- Large, multi-category catalogs: expect a meaningful but more moderate share, roughly 40–55%. Afridi Imports still crossed the halfway mark despite its size and category breadth, which suggests the mechanic holds up even when it’s competing with many other revenue drivers.
- Niche, project-based catalogs (craft supplies, hobbyist goods): expect the lower end of the range, but not a negligible one. Resin Rockers and LNDA both still saw upsell and cross-sell account for roughly a third to two-fifths of AI-driven revenue — a real contribution, just a smaller share of the total.
The Upside of Running Upsell & Cross-Sell Together
The recurring theme across all eight stores is that upsell & cross-sell aren’t a marginal feature — they’re a substantial share of what an AI recommendation engine actually contributes to revenue. A store running only one of the two mechanics, or running them through disconnected apps that don’t coordinate, is very likely leaving a meaningful percentage of this on the table.
This is the same argument at the center of our comparison of the top Shopify upsell & cross-sell apps: coverage across the full customer journey, through one coordinated engine, consistently outperforms a patchwork of single-purpose tools. These eight stores are a real-world instance of that thesis, not just a theoretical one.
FAQ
AOV Lift or Revenue Share: What’s Actually Being Measured?
These figures show upsell & cross-sell revenue as a share of total AI-driven revenue for each store — not a direct AOV percentage increase. They indicate how much of a store’s AI-attributed revenue is coming specifically from these two mechanics, which is a strong proxy for impact, though a distinct metric from AOV lift itself.
Why Does the Range Vary So Much Between Stores?
Primarily catalog type. Stores with naturally complementary or consumable products see a higher share, since nearly every purchase has an obvious next-item recommendation. Larger, multi-category catalogs tend to sit lower simply because upsell and cross-sell are two of several revenue levers rather than the primary one.
Can You See This Data for Your Own Store?
Yes — this is exactly the kind of breakdown available inside the Wiser AI dashboard for any connected store, updated in real time rather than as a static three-month snapshot.
Curious what your own upsell & cross-sell share looks like? Wiser AI’s free plan makes it possible to find out directly from your own dashboard.